BROADCASTING LIVE: ACTIVE MONITORING OF INTERIM STANDINGS
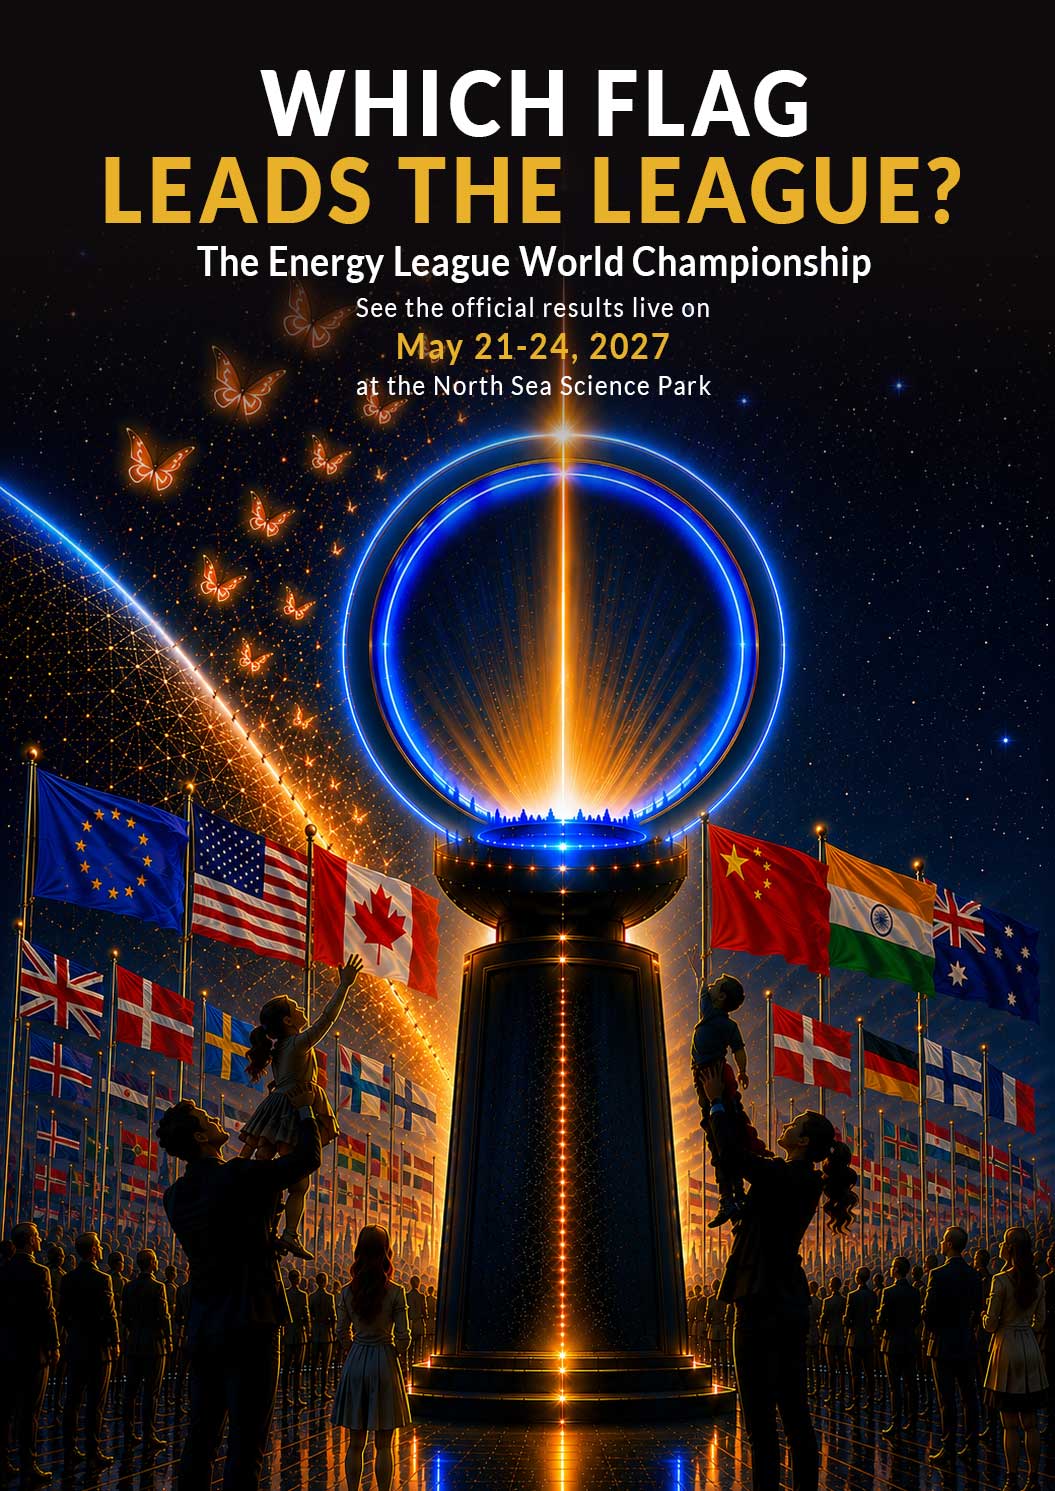
To maintain tournament momentum and keep team spirit active on the shop floor, the ELWC program operates with continuous, weekly standings between the major annual events. Corporations and municipalities are encouraged to proudly broadcast and share their interim progress across corporate hallways as soon as a new butterfly is ignited on their local energy ring. This entire cross-sectoral team sport can be monitored live via our official communication channels on LinkedIn and Facebook. Follow our digital feeds to track which flags and enterprises are currently shifting positions and leading the way for the global workforce.
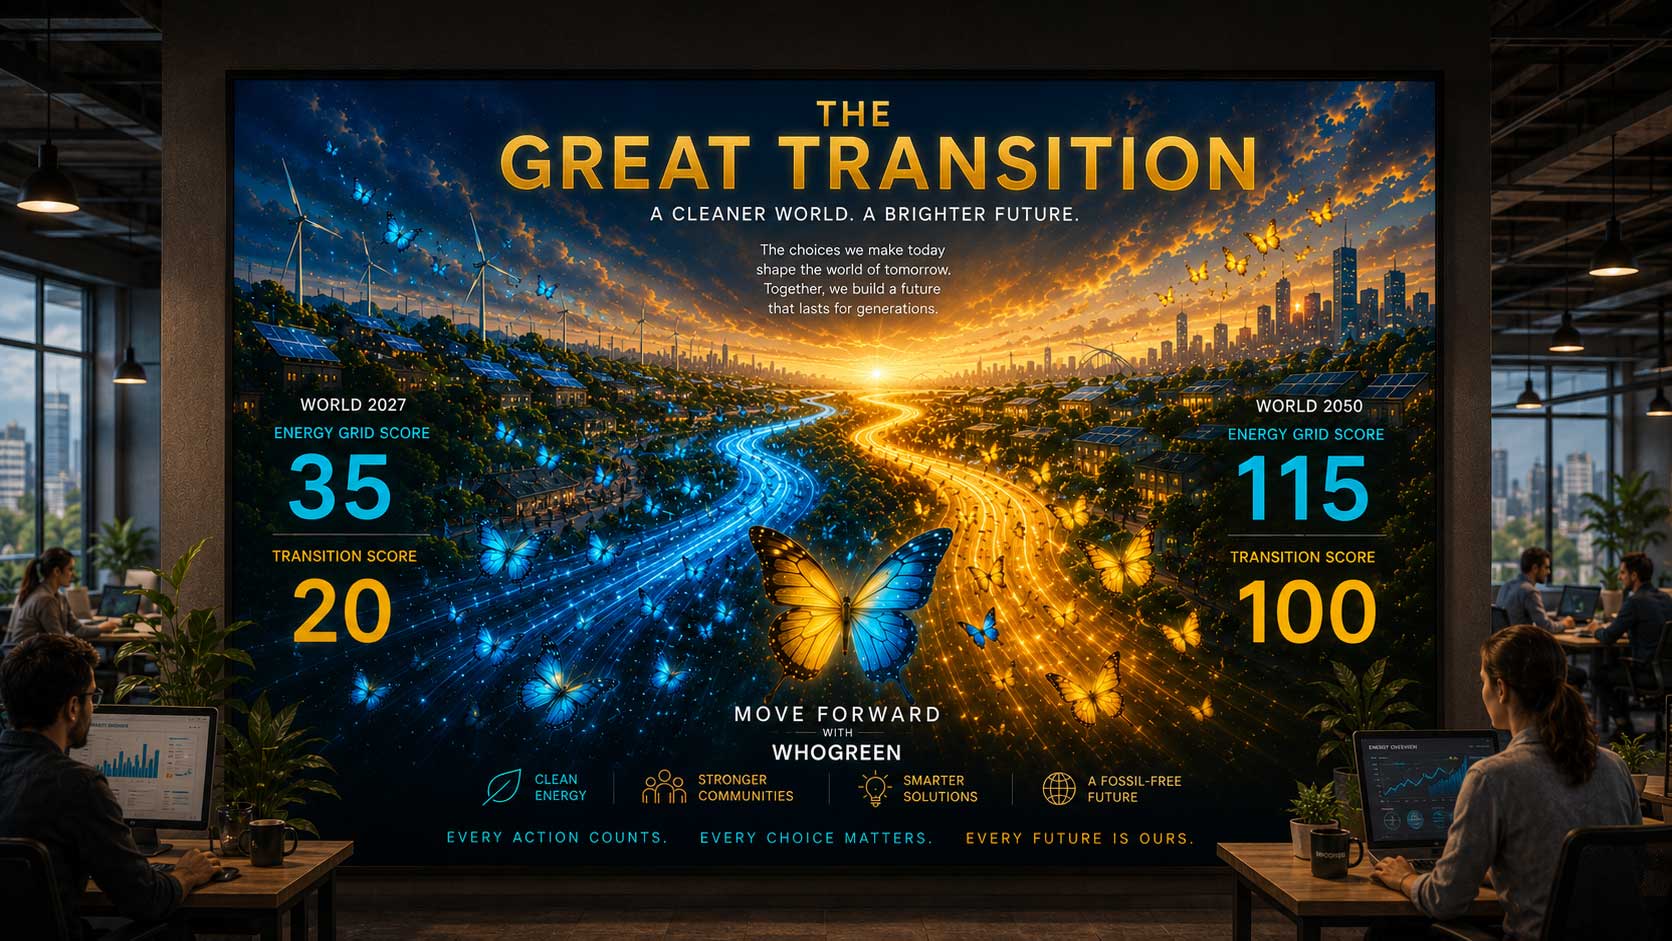
Global & Regional Transition Baselines examples 2025–2026
This section delivers a verified, high-level preview of the raw, physical resource volumes currently recorded on the global and Nordic leaderboard, audited independently in universal kWh under Scope 1 and Scope 2.
| Country / Continent | Energy Grid Score (Power) | Transition Score (Total Energy in kWh) |
| World (Global Average) 🌍 | ≈ 30% | ≈ 15% |
| European Union (EU) 🇪🇺 | ≈ 42–45% | ≈ 23–25% |
| Denmark 🇩🇰 | ≈ 75–80% | ≈ 45–50% |
| Sweden 🇸🇪 | ≈ 75% | ≈ 52–55% |
| Norway 🇳🇴 | ≈ 98% | ≈ 50–52% |
| Finland 🇫🇮 | ≈ 55% | ≈ 43–45% |
| Iceland 🇮🇸 | ≈ 100% | ≈ 75–78% |
| United Kingdom (UK) 🇬🇧 | ≈ 45% | ≈ 20–22% |
| United States (USA) 🇺🇸 | ≈ 22–25% | ≈ 12–14% |
| Canada 🇨🇦 | ≈ 65% | ≈ 22–24% |
| Australia 🇦🇺 | ≈ 35% | ≈ 10–12% |
| India 🇮🇳 | ≈ 22–24% | ≈ 11–13% |
| China 🇨🇳 | ≈ 36–38% | ≈ 16–18% |
| Asia (Total Continent) 🌏 | ≈ 26–28% | ≈ 11–13% |
| South America (Total Continent) 🌎 | ≈ 70–75% | ≈ 33–35% |
| Brazil 🇧🇷 | ≈ 88% | ≈ 48–50% |
| Africa (Total Continent) 🌍 | ≈ 22–25% | ≈ 10–12% |
| Kenya 🇰🇪 | ≈ 90% | ≈ 22–24% |